| sybil: strepneumo: pangenome | [db=strepneumo_v15] |
| Background |
|
Large single species data sets, like the one found in strepneumo-sybil, are becoming more and more common as ultra-high throughput sequencing technology has become ubiquitous. The goal of the pan-genome is to estimate the gene repertoire size of a set of organisms (typically a single species) given a large number of sequenced strains. The analysis involves 6 steps as described below:
*-There is a small amount of redundancy introduced by gene duplication events (paralogs). |
| New Genes |
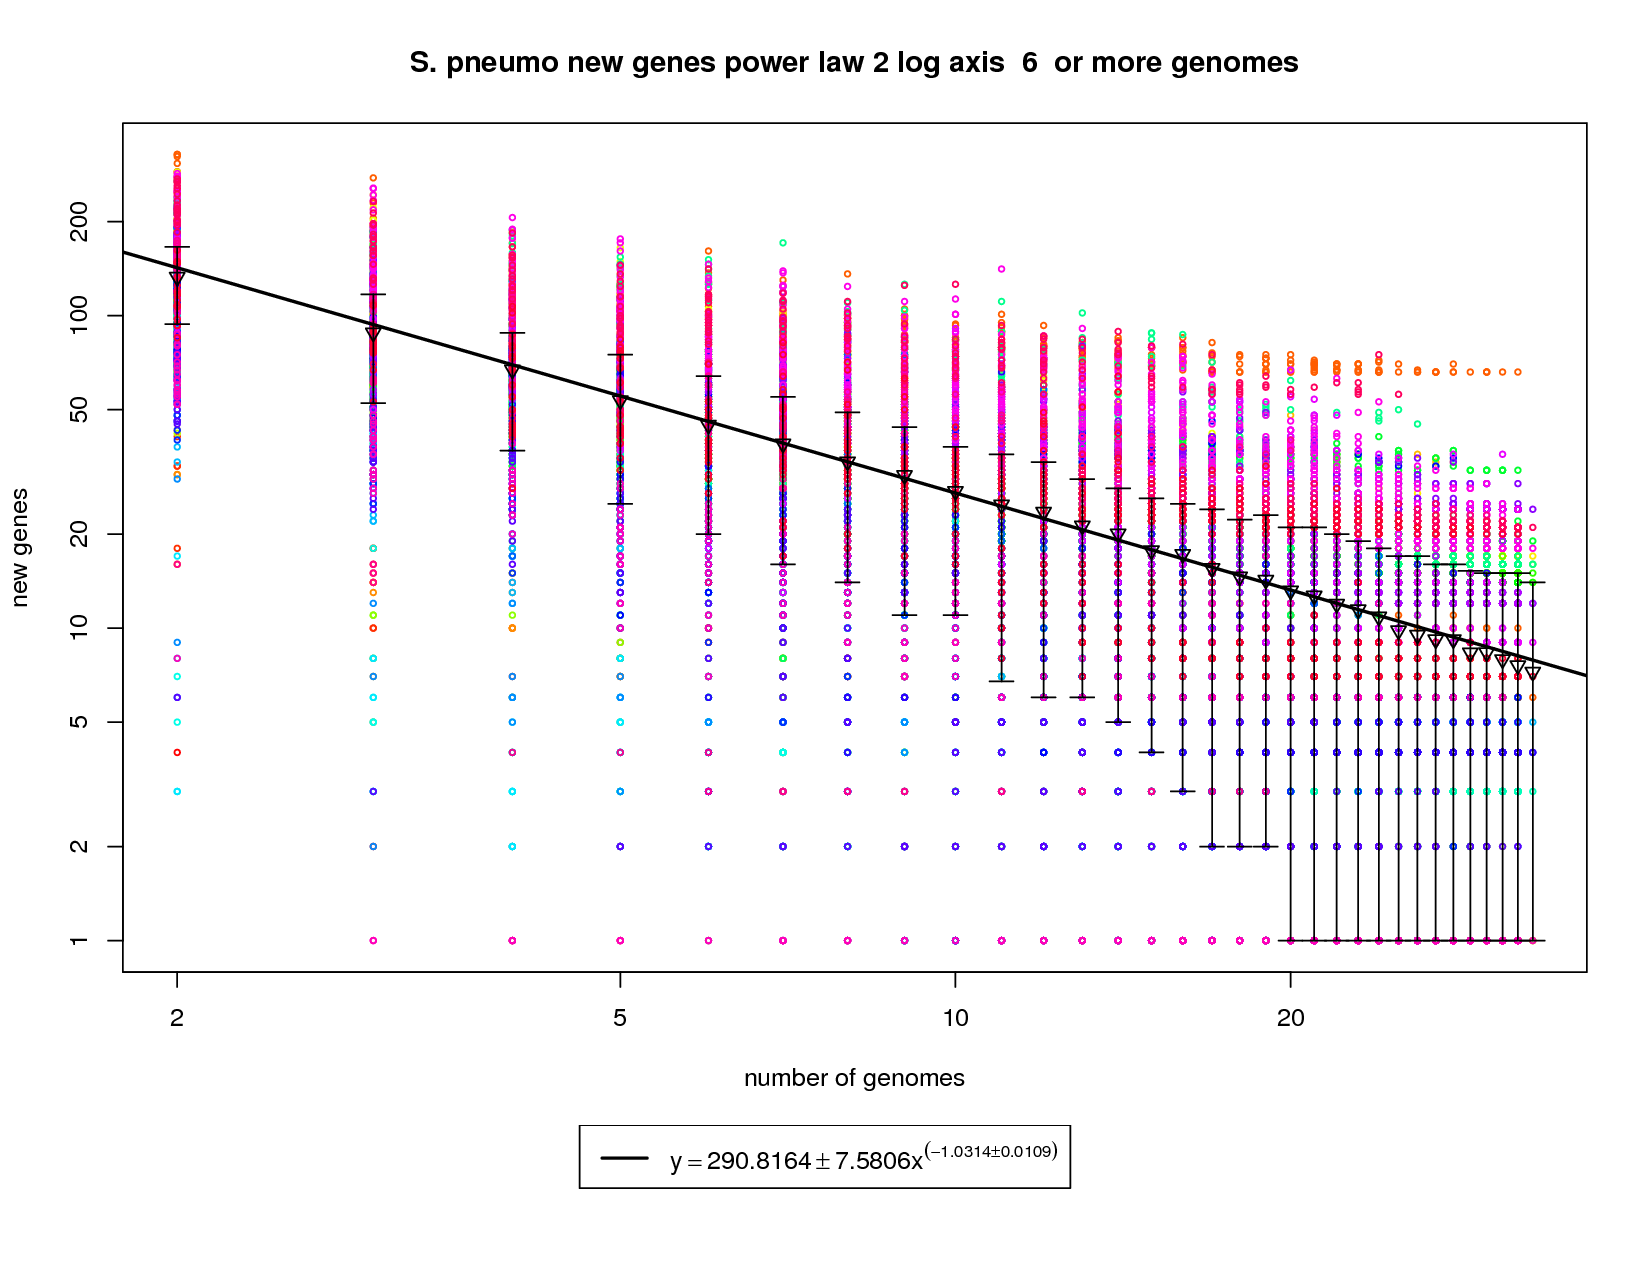
The new genes graph here shows each genome as a different colored circle when that genome is chosen as the 'out group'. The error bars show the 1st and 3rd quartiles and the inverted triangle is the mean. The model is drawn as a solid line fit to the means. The model was fit only on genome counts above 6. This strategy was implemented to avoid the left side bias that could skew the results. This figure shows that as the number of sequenced strains increases the number of new genes decreases. The power-law model has a slope of -1.03 which (since it is greater than 1) indicates that the number of new genes will continue to decrease and this appears to be a slightly closed pan-genome. The right side of the graph has several instances where the error bars extend all the way to the bottom. This indicates that there are several genomes that contribute 0 or close to 0 new genes to the remaining set. The last mean value is ~7 and by the time 50 sequenced genomes are available this model suggests that there would be ~5 new genes per genome. This reduces to ~2.5 at 100 genomes. While this is technically a 'closed' pan-genome based on the method suggested by Tettelin et al. it is closing slowly such that new genes will still be found out to 100 sequenced genomes. |
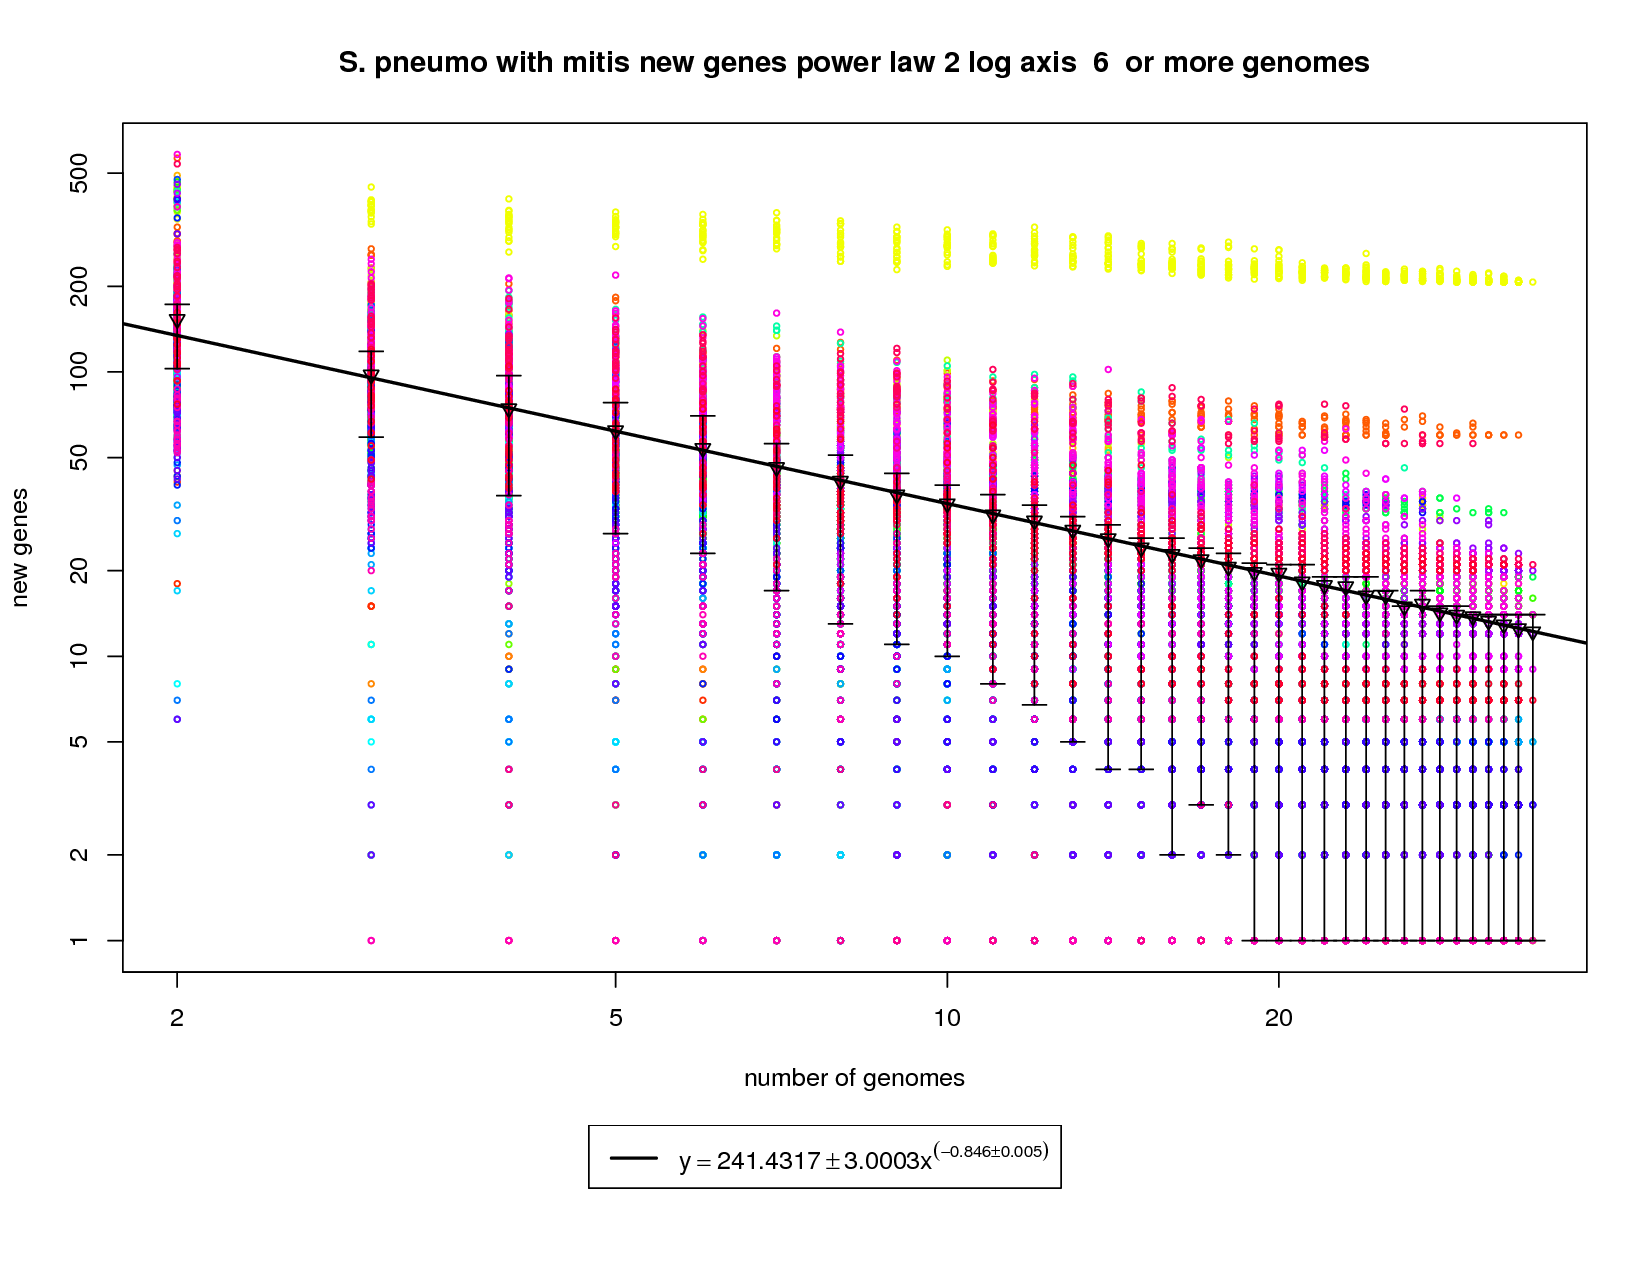
This new genes graph adds the out-group mitis genome. Like the first graph it shows each genome as a different colored circle when that genome is chosen as the 'out group'. The error bars show the 1st and 3rd quartiles and the inverted triangle is the mean. The model is drawn as a solid line fit to the means. The model was fit only on genome counts above 6. This strategy was implemented to avoid the left side bias that could skew the results. This plot has been provided to show how a genome from a different but highly related species (S. mitis shown in yellow) can provide enough diversity to change the plot from showing a nearly closed pan-genome to a confidently open one. Here the slope of -0.846 is less than 1 indicating that the number of new genes found for each additional genome could remain high. at 34 the average number of new genes found per genome is ~12. This number is expected to fall to ~9 at 50 genomes and ~5 by 100 genomes. This means that if S. mitis genomes are sampled along with pneumo genomes one could expect to find new genes at approximately twice the rate of just sampling S. pneumo genomes. |
| Core Genes |

The core genes graph estimates the size of the core genome as more genomes are sequenced. The colored circles represent the count of core genes present when that particular genome is used as an out group. The error bars again show the 1st and 3rd quartiles and the triangles show the means. An power law model is used and is fit to the means above 6 genomes. In this figure the size of the core genome appears to decrease as more genomes are sequenced. However the slope of the fitted power-law function indicates that the decrease is very slow. In this case the core genome contains ~ 1858 genes when 34 genomes are considered. At 50 sequenced genomes this number is estimated to drop just slightly to ~ 1836 and at 100 genomes the model estimates the number of core genes could drop slightly more to ~1797 genes. This nearly flat slope suggests that the core-genome of S. pneumo is somewhat stable. Since the average S. pneumo genome is ~2100 genes this leaves ~300 dispensible genes to account for the variability of the species. |
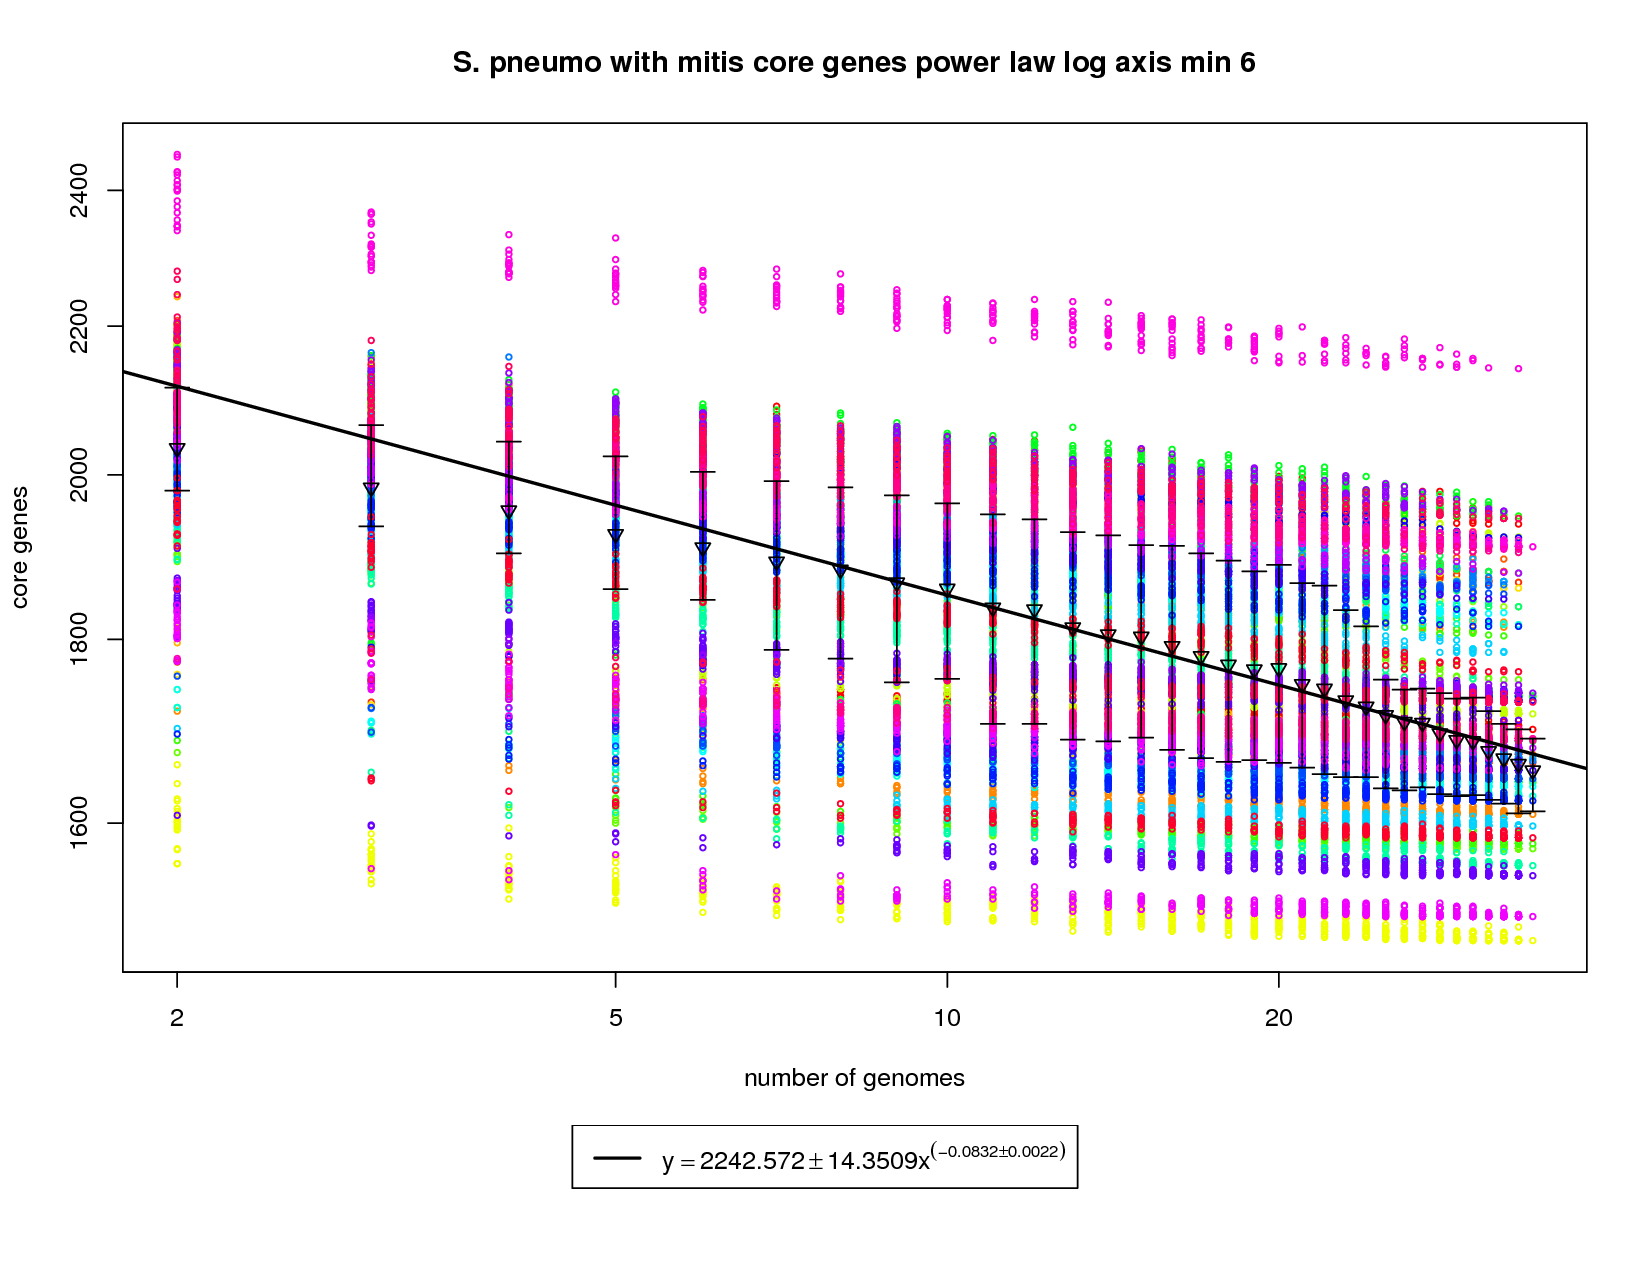
This core genes graph adds the S. mitis genome but uses the same method as the pneumo only one. The colored circles represent the count of core genes present when that particular genome is used as an out group. The error bars again show the 1st and 3rd quartiles and the triangles show the means. An power law model is used and is fit to the means above 6 genomes. The addition of S. mitis (shown as yellow circles) significantly increases the speed at which the core-genome shrinks. At 34 genomes the size of the core genome is estimated to be ~1672. This is significantly less than the estimate derived using pneumo-only data (1858). At 50 genomes that number drops to ~1619 and at 100 it ~1528. This increases the number of dispensible genes from ~300 for pneumo only to ~500 if S. mitis is included. |
| Pan-genome |
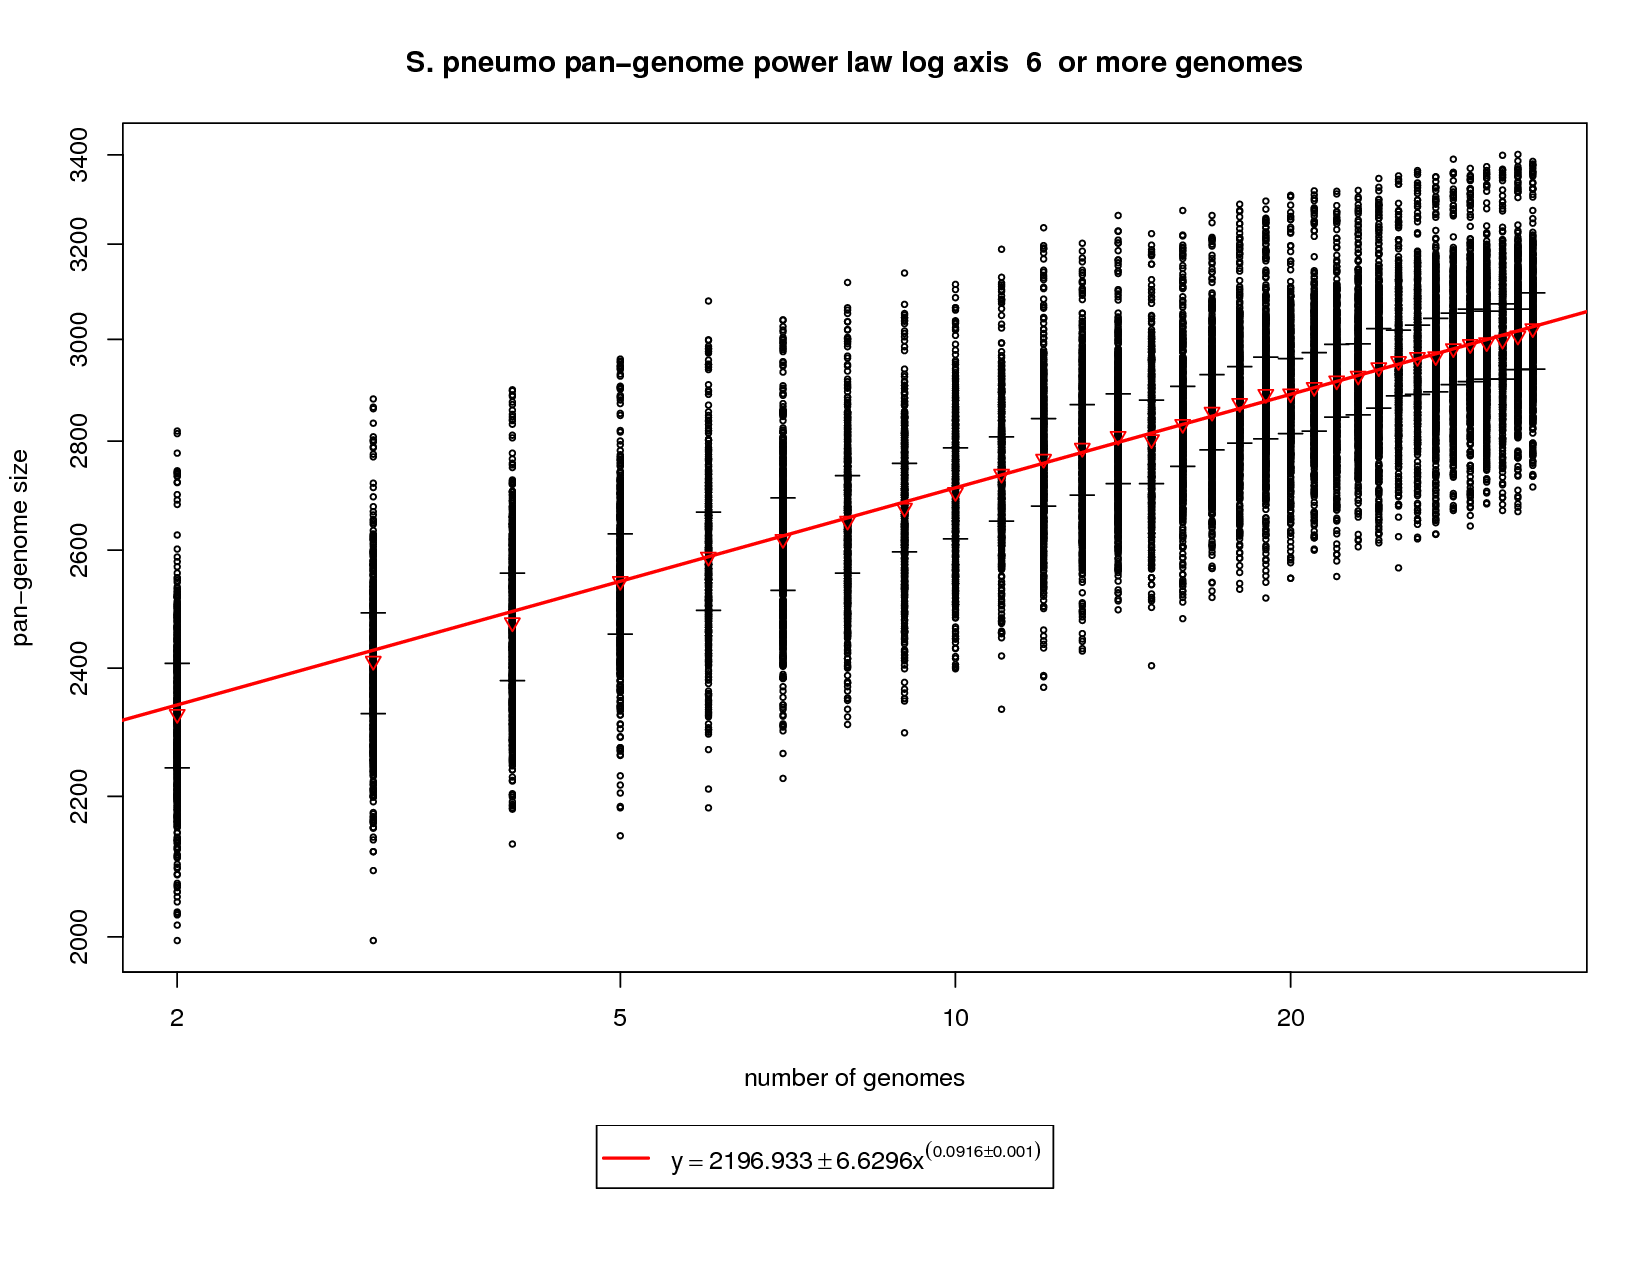
The pan-genome estimates the trend of the entire gene repertoire of the species. This figure shows each sampled combination of genomes as a black ring. Because there is no 'out genome' in this analysis the rings cannot be colored. The error bars represent the 1st and third quartiles and the red triangle represents the median. The power law function is fit on the medians and is fit to the means above 6 genomes. This figure shows a growing pan-genome as more genomes are sequenced. However, the slope (~0.1) of the power law again tells us that this growth is slow. At 34 genomes this value is estimated to be ~3033 genes. At 50 genomes this value is estimated to grow to ~3142 and at 100 genomes ~3343. This somewhat contradicts what the new genes graph shows in that a slope above 0 (0.1) indicates an open pan-genome. This can be attributed to the nature of the S. pneumo data set being a fringe case. More sequenced genomes have the potential to provide additional genomic diversity but this return will most likely diminish as the number approaches 100 genomes. |
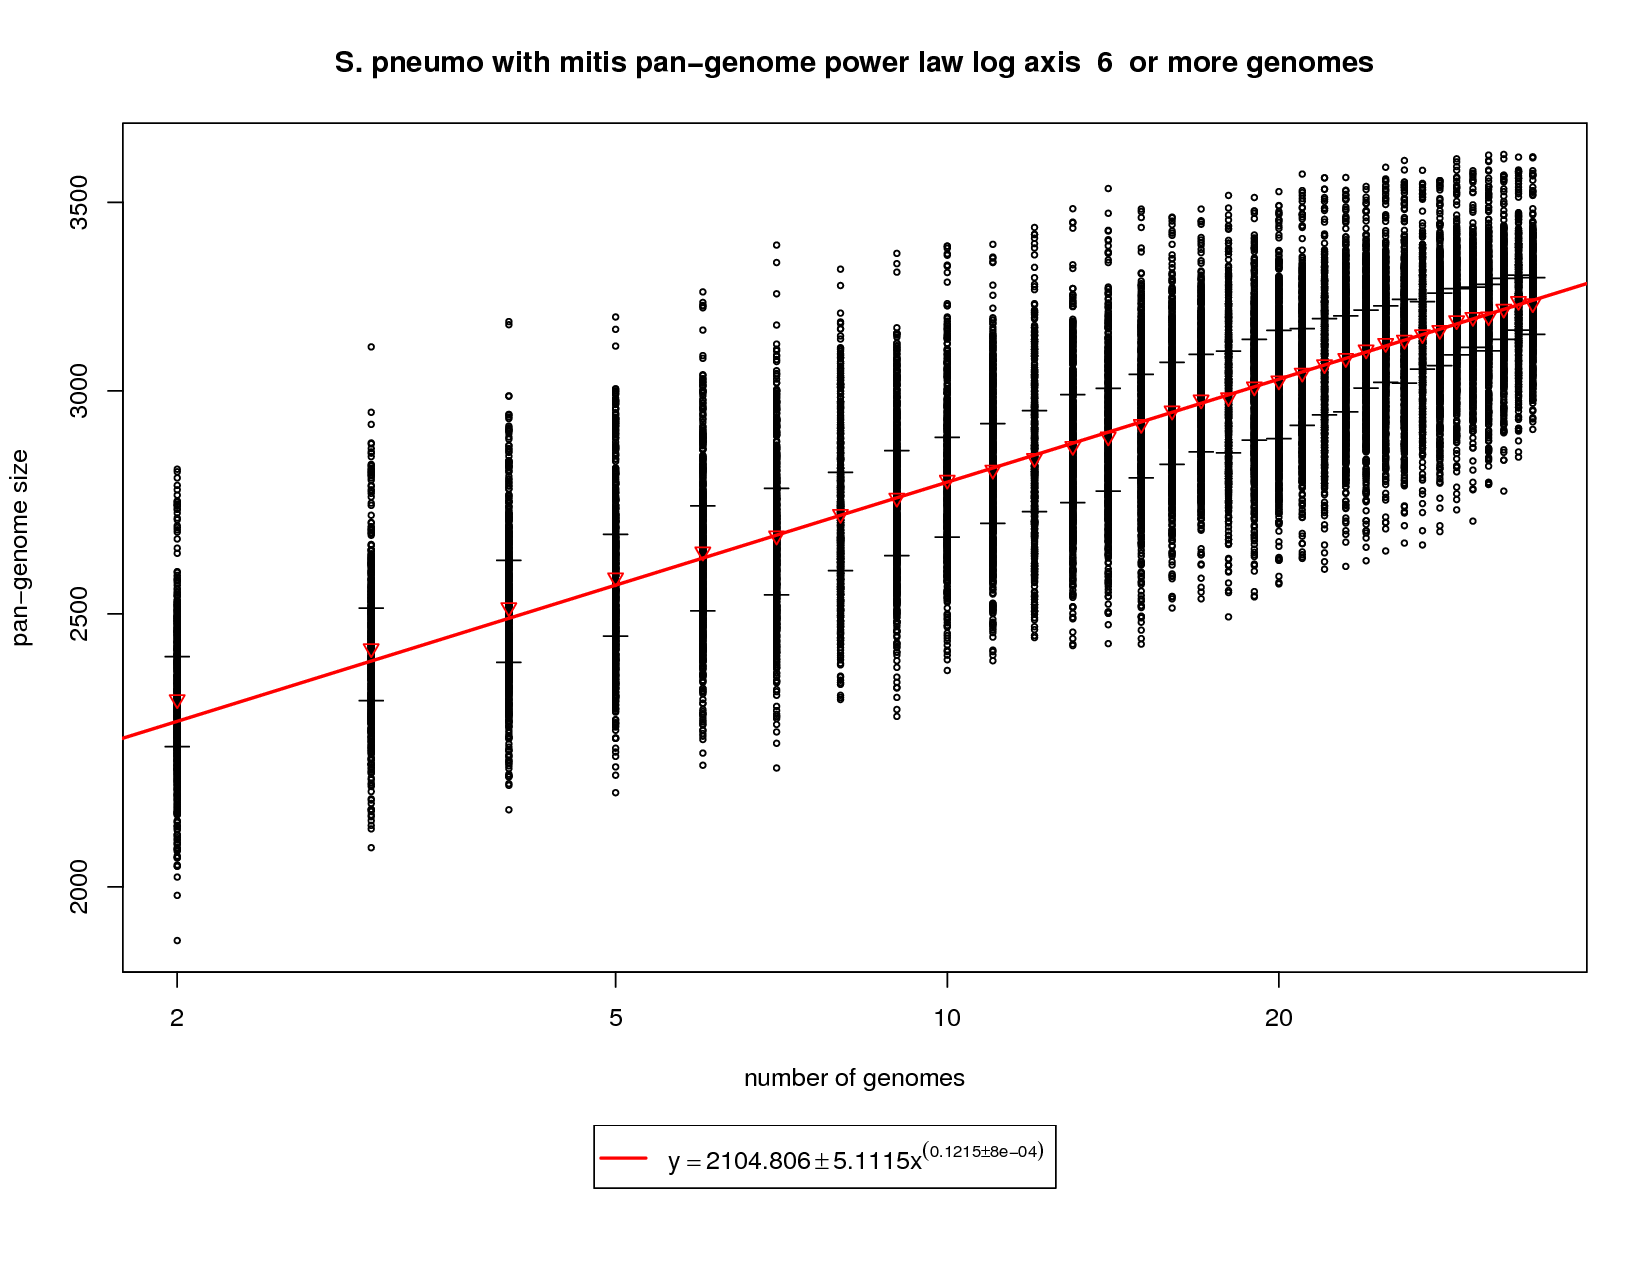
This plot incorporates the S. mitis genome while utilizing the same procedure described above. Each sampled combination of genomes is show as a black ring. Because there is no 'out genome' in this analysis the rings cannot be colored. The error bars represent the 1st and third quartiles and the red triangle represents the median. The power law function is fit on the medians and is fit to the means above 6 genomes. The rate of pan-genome growth increases significantly, as one would expect, with the addition of S. mitis. The slope of the regression is ~0.1215. At 34 genomes this comes out to ~3229 genes vs. ~3033 with pneumo only. At 50 genomes the gene repertoire grows to ~3384 (3142 with pneumo only) and at 100 the prediction is ~3681 (3343 with pneumo only). This correlates well to the new genes and core genes graph and shows what an out group genome can show. |
| Raw Data |
|
The data files used to generate the above figures are available for download below:
|
| References |
| sybil web site: sybil.sourceforge.net | e-mail: driley@som.umaryland.edu |